Aggregate CCE Logs with Grafana Alloy & Grafana Loki
This blueprint explains how to collect and centralize logs from Cloud Container Engine (CCE) using Grafana Alloy and Grafana Loki. It outlines the process of configuring Grafana Alloy as a unified telemetry collector within Kubernetes and integrating it with Grafana Loki for efficient storage and visualization. By the end, you will have a modern, future-proof, and scalable logging setup that simplifies monitoring, troubleshooting, and operational insights across your CCE workloads.
What is Grafana Alloy?
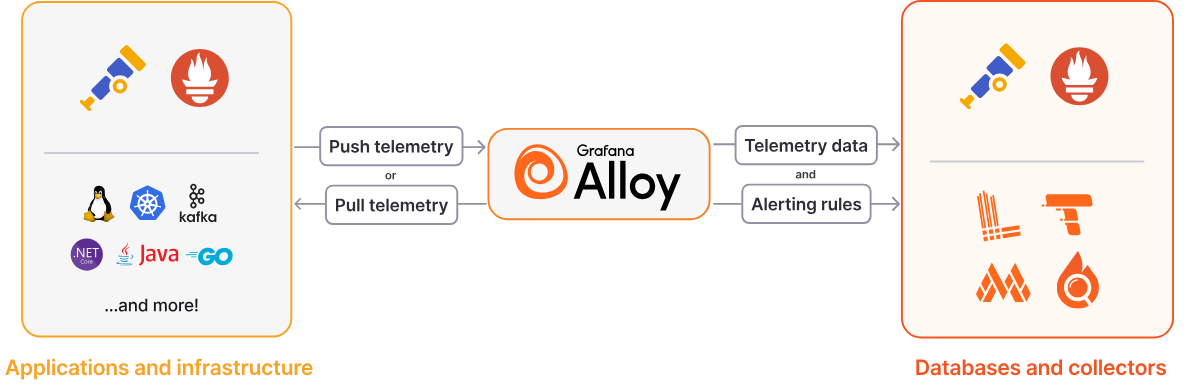
Grafana Alloy is a flexible, high-performance, vendor-neutral telemetry Collector. It also replaces Promtail as the actively maintained log collection agent. Alloy is fully compatible with popular open source observability standards such as OpenTelemetry and Prometheus, focusing on ease of use and the ability to adapt to the needs of power users.
Unlike Promtail, which was designed solely for log collection, Alloy is a unified telemetry collector that natively supports all observability signals including logs, metrics, traces, and profiles. This "big tent" approach means you can deploy a single agent per node instead of managing multiple specialized collectors.
Grafana Loki serves as a log aggregation system optimized for scalability, availability, and cost efficiency. Drawing inspiration from Prometheus, Loki indexes only metadata through labels rather than the log content itself. Loki groups log entries into streams and indexes them with labels, which reduces overall costs and the time between log entry ingestion and query availability.
Why Choose Grafana Alloy?
Grafana Alloy represents the future of telemetry collection in the Grafana ecosystem. Its unified approach to collecting logs, metrics, traces, and profiles reduces operational complexity while providing enterprise-grade features like clustering, GitOps support, and advanced debugging capabilities. With Promtail reaching end-of-life in March 2026, migrating to Alloy ensures your logging infrastructure remains supported and gains access to ongoing feature development.
The component-based architecture provides flexibility to adapt to changing requirements without replacing the entire collector. Whether you're collecting simple container logs or building complex observability pipelines with multiple data sources and destinations, Alloy's extensibility and OpenTelemetry-native design future-proof your investment.
Installing Grafana Loki
If you don't already have a Grafana Loki instance running, you can set it up first before proceeding with log aggregation. The installation process is covered in detail in the companion blueprint Deploy Grafana Loki on CCE, which explains how to deploy Loki in microservices mode on Cloud Container Engine (CCE) with Open Telekom Cloud Object Storage (OBS) as the backend. Once Loki is up and running, you can continue here to install and configure Grafana Alloy and start collecting and centralizing logs from your CCE workloads.
Installing Grafana Alloy
Configuring Grafana Alloy for CCE Log Collection
Create a ConfigMap for Alloy's configuration. This will be referenced in the Helm values file.
apiVersion: v1
kind: ConfigMap
metadata:
  name: alloy-logs-config
  namespace: monitoring
data:
  config: |
    // Discover all pods in the cluster
    discovery.kubernetes "pods" {
      role = "pod"

      // Restrict to pods on the same node to reduce resource usage
      selectors {
        role = "pod"
        field = "spec.nodeName=" + coalesce(sys.env("HOSTNAME"), constants.hostname)
      }

      // This attaches node metadata to pod targets
      attach_metadata {
        node = true
      }
    }


    // Relabel discovered pods and create file paths
    discovery.relabel "pod_logs" {
      targets = discovery.kubernetes.pods.targets

      // Extract namespace
      rule {
        source_labels = ["__meta_kubernetes_namespace"]
        action = "replace"
        target_label = "namespace"
      }

      // Extract pod name
      rule {
        source_labels = ["__meta_kubernetes_pod_name"]
        action = "replace"
        target_label = "pod"
      }

      // Extract container name
      rule {
        source_labels = ["__meta_kubernetes_pod_container_name"]
        action = "replace"
        target_label = "container"
      }

      // Add region label from node
      rule {
        source_labels = ["__meta_kubernetes_node_label_topology_kubernetes_io_region"]
        target_label  = "region"
      }

      // Add availability zone label from node
      rule {
        source_labels = ["__meta_kubernetes_node_label_topology_kubernetes_io_zone"]
        target_label  = "zone"
      }

      // Create job label from namespace/container
      rule {
        source_labels = ["__meta_kubernetes_namespace", "__meta_kubernetes_pod_container_name"]
        action = "replace"
        target_label = "job"
        separator = "/"
        replacement = "$1"
      }

      // Extract app label if it exists
      rule {
        source_labels = ["__meta_kubernetes_pod_label_app_kubernetes_io_name"]
        action = "replace"
        target_label = "app"
      }

      // Create file path for pod logs
      rule {
        source_labels = ["__meta_kubernetes_pod_uid", "__meta_kubernetes_pod_container_name"]
        action = "replace"
        target_label = "__path__"
        separator = "/"
        replacement = "/var/log/pods/*$1/*.log"
      }

      // Extract container runtime
      rule {
        source_labels = ["__meta_kubernetes_pod_container_id"]
        action = "replace"
        target_label = "tmp_container_runtime"
        regex = "^(\\w+):\\/\\/.+$"
        replacement = "$1"
      }

      // Drop pods with no container ID (not yet running)
      rule {
        source_labels = ["__meta_kubernetes_pod_container_id"]
        action = "drop"
        regex = ""
      }
    }


    // Match actual log files on disk
    local.file_match "pod_logs" {
      path_targets = discovery.relabel.pod_logs.output
    }


    // Read logs from files
    loki.source.file "pod_logs" {
      targets = local.file_match.pod_logs.targets
      forward_to = [loki.process.pod_logs.receiver]
    }


    // Process and enrich logs
    loki.process "pod_logs" {

      // Parse containerd/CRI-O logs
      stage.match {
        selector = "{tmp_container_runtime=\"containerd\"}"

        stage.cri {}

        // Extract stream label (stdout or stderr)
        stage.labels {
          values = {
            stream = "",
          }
        }
      }


      // Add static labels like cluster identifier
      stage.static_labels {
        values = {
          cluster = "production",
        }
      }

      // Drop temporary labels
      stage.label_drop {
        values = ["tmp_container_runtime", "filename"]
      }

      forward_to = [loki.write.default.receiver]
    }

    // Write configuration - sends logs to Loki
    loki.write "default" {
      endpoint {
        url = "http://loki-gateway.monitoring.svc.cluster.local/loki/api/v1/push"
      }

      // External labels applied to all logs
      external_labels = {
        aggregator = "alloy",
      }
    }
This is a baseline configuration and you may need to adjust it based on your specific environment and requirements.
By setting attach_metadata {node = true}, Alloy attaches node-level metadata to pod targets, which enables extraction of availability zone and region labels in the subsequent relabeling rules. This is useful for multi-region deployments and debugging location-specific issues.
Then apply the ConfigMap:
kubectl apply -f alloy-configmap.yaml
Understanding the Alloy Configuration
The Alloy configuration uses a component-based approach where each component performs a specific task and forwards data to the next component in the pipeline.
- Discovery Components: The
discovery.kubernetescomponent discovers pods in the cluster, whilediscovery.relabelfilters and labels the discovered targets. This is similar to Prometheus service discovery but integrated directly into the collector. - Source Component: The
loki.sourcecomponent reads log files from the discovered pod targets and forwards them to the processing stage. - Processing Pipeline: The
loki.processcomponent applies multiple stages to transform and enrich the logs. It parses CRI format, extracts JSON fields, handles timestamps, and creates labels. - Write Component: The
loki.writecomponent sends the processed logs to Loki with configurable batching, retry, and timeout settings.
Installing Grafana Alloy via Helm
Now create a values file called values-alloy.yaml:
alloy:
  # Use a ConfigMap for configuration
  configMap:
    create: false
    name: alloy-logs-config
    key: config

  # Should be disabled when using DaemonSet as controller
  clustering:
    enabled: false  # Enable for high availability

  # Mount host paths for log collection
  mounts:
    # Mount /var/log for pod logs
    varlog: true
    # On CCE, containerd logs are under /var/lib/containerd/container_logs and should be mounted explicitly
    extra:
      - name: containerd-logs
        mountPath: /var/lib/containerd/container_logs
        readOnly: true

  # Resource limits for production
  resources:
    limits:
      cpu: 1000m
      memory: 1Gi
    requests:
      cpu: 500m
      memory: 512Mi

  # Security context required for reading pod logs
  securityContext:
    privileged: true
    runAsUser: 0
    runAsGroup: 0
    fsGroup: 0

  # Extra environment variables for selecting based on node name
  extraEnv:
    - name: HOSTNAME
      valueFrom:
        fieldRef:
          fieldPath: spec.nodeName

# Deploy as DaemonSet
controller:
  type: 'daemonset'
  volumes:
    extra:
      - name: containerd-logs
        hostPath:
          path: /var/lib/containerd/container_logs

  # Update strategy
  updateStrategy:
    type: RollingUpdate
    rollingUpdate:
      maxUnavailable: 1

# Service account settings
serviceAccount:
  create: true

# RBAC permissions
rbac:
  create: true
Alloy supports collecting logs through the Kubernetes API server instead of mounting host paths. This approach doesn't require privileged security contexts and can be useful for development or environments with strict security policies. However, for production systems, directly mounting log directories is recommended as it provides better performance by removing the log request load from the Kubernetes API server.
On CCE, containerd stores container logs at /var/lib/containerd/container_logs. The standard /var/log/pods path is a symbolic link to that path. You must explicitly mount this directory in your Alloy DaemonSet configuration (as shown in the mounts.extra section above) to ensure all container logs are collected. Without this mount, logs from containerd-based containers will not be accessible to Alloy.
Deploy Grafana Alloy via Helm:
helm repo add grafana https://grafana.github.io/helm-charts
helm repo update

helm upgrade --install alloy grafana/alloy \
  -f values-alloy.yaml \
  -n monitoring --create-namespace \
  --reset-values
Verifying the Installation
After deploying Alloy, verify that it's collecting and forwarding logs correctly.
First, check that all Alloy pods are running:
kubectl get pods -n monitoring -l app.kubernetes.io/name=alloy
All pods should show a Running status. Next, access the Alloy UI by port-forwarding to one of the pods:
kubectl port-forward -n monitoring daemonset/alloy 12345:12345
Open your browser and navigate to http://localhost:12345. In the Alloy UI:
- Click on Graph to view the component pipeline visualization
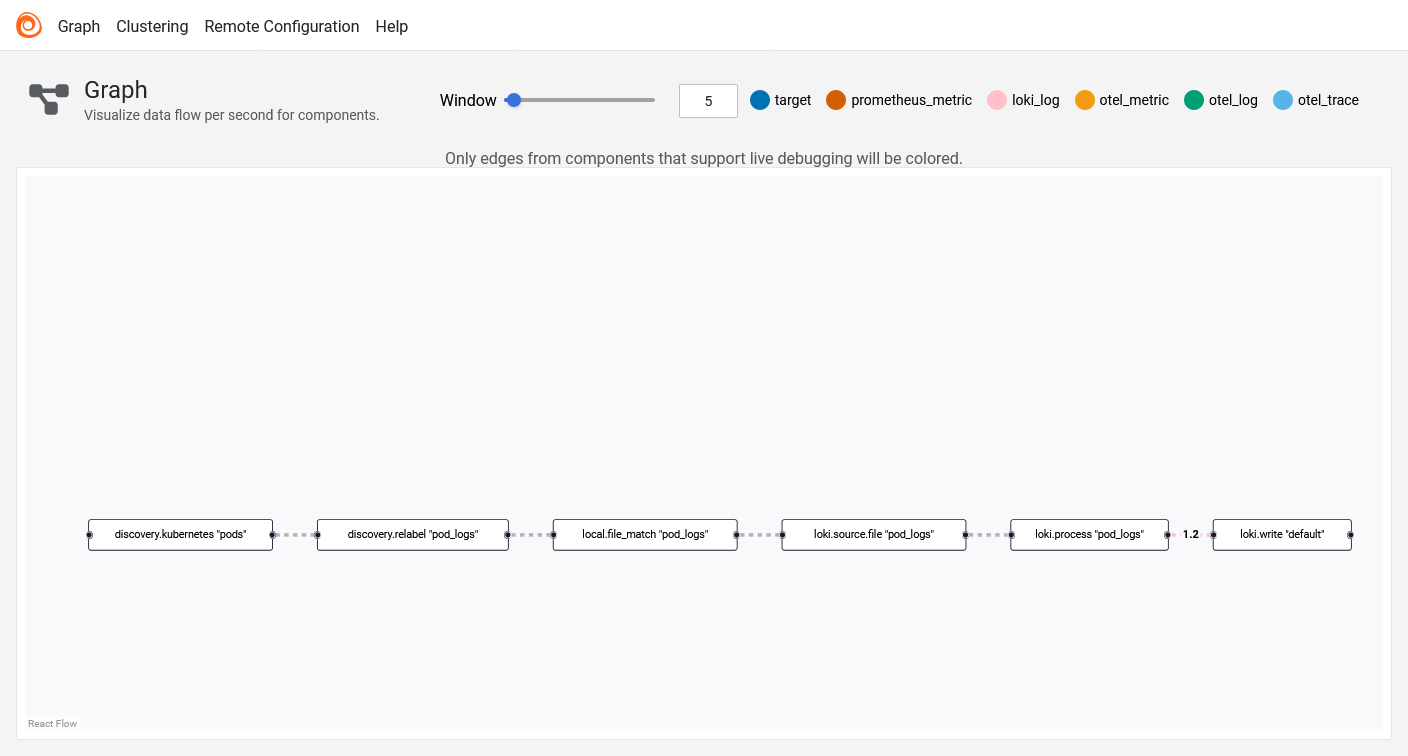
- Click on Alloy logo to get list of defined components and verify that all components show a green status indicator

- Click on the
loki.source.filecomponent to see active targets and log files being read
To confirm logs are arriving in Loki, navigate to Grafana and run a simple query in Explore or view the Drilldown section:
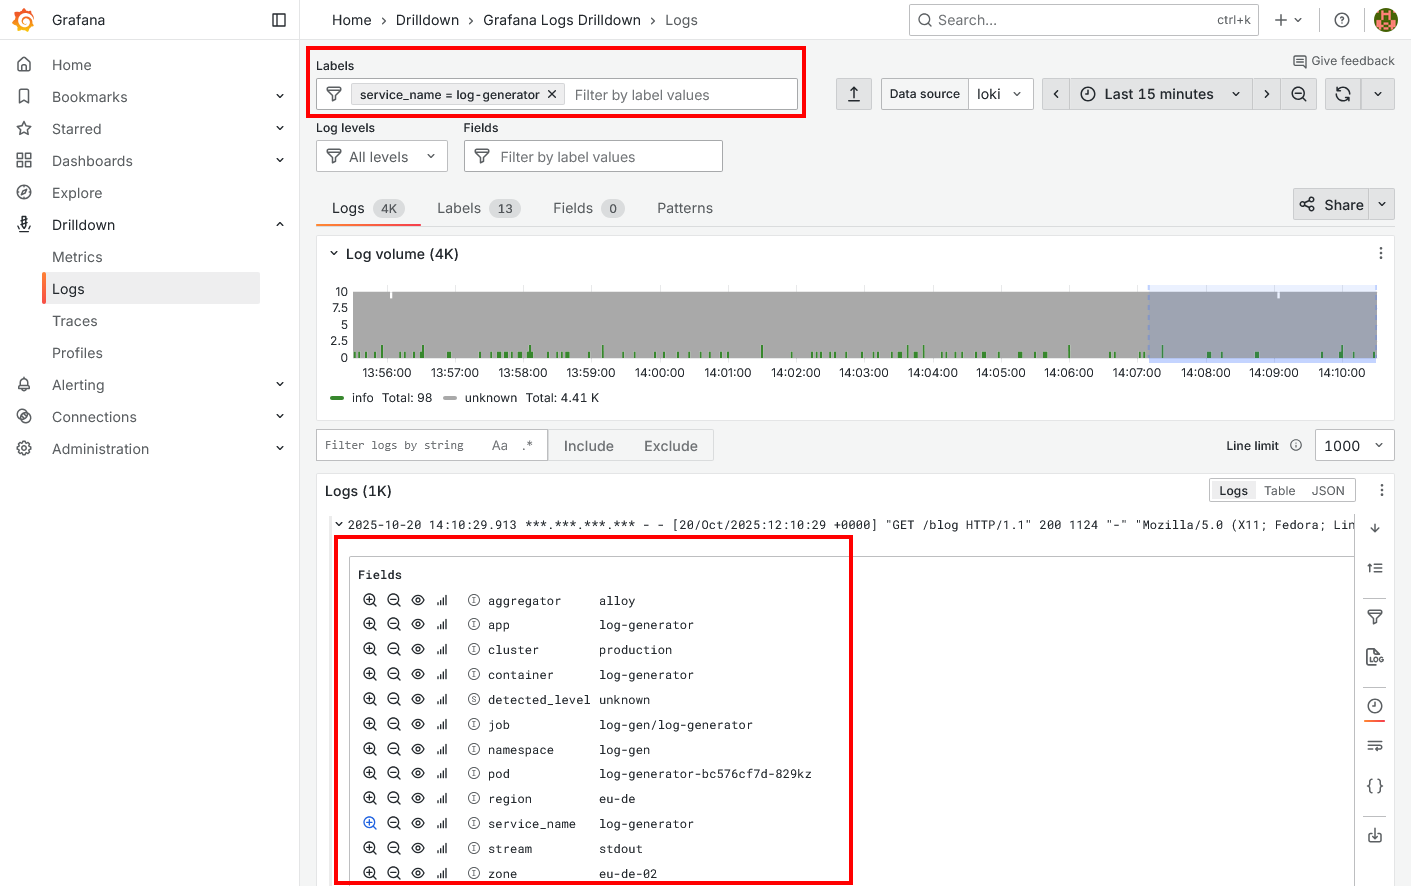
You should see logs from pods. If logs appear with labels like pod, namespace, container, region, and zone, your Alloy configuration is working correctly. If no logs appear, check the Alloy component details for error messages and verify that the Loki endpoint URL is correct in your configuration.